
Here in North America meteorological Fall started on September 1st. But if you live here and have been paying attention, you may have noticed that the usual cooling after the Summer season has been arriving late. That’s because the Autumn season has been steadily warming for decades. Since 1970, average Fall temperatures have risen in every single county in the United States.
On average, Fall temperatures are now a remarkable 2.8°F warmer than they were in the early 1970s. This might seem like a small number, but it has significant impacts on our environment, from delayed leaf changes to extended allergy seasons. It’s a clear signal of our changing climate, right in the middle of a season we often associate with cooling down.
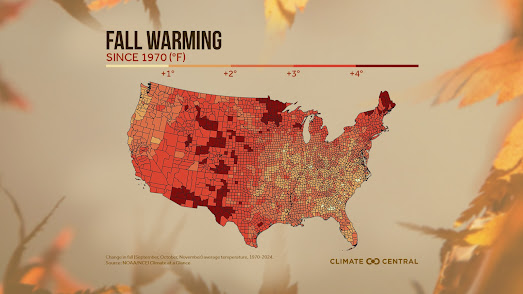
You can explore how much warmer autumnal temperatures are in the U.S. on Climate Central’s Fall Warming. The map reveals that the Southwest is experiencing some of the fastest-rising fall temperatures, with many counties in New Mexico and Arizona seeing rises of over 4°F.
You can click on individual counties on the interactive map to see the change in average fall temperature (°F) since 1970. For a deeper dive, you can download a static image of the map and line charts showing the average rise in fall temperatures from Climate Central’s 2025 2025 Fall Package.


They’re frightening statistics, yet many still don’t believe that we have a problem.