
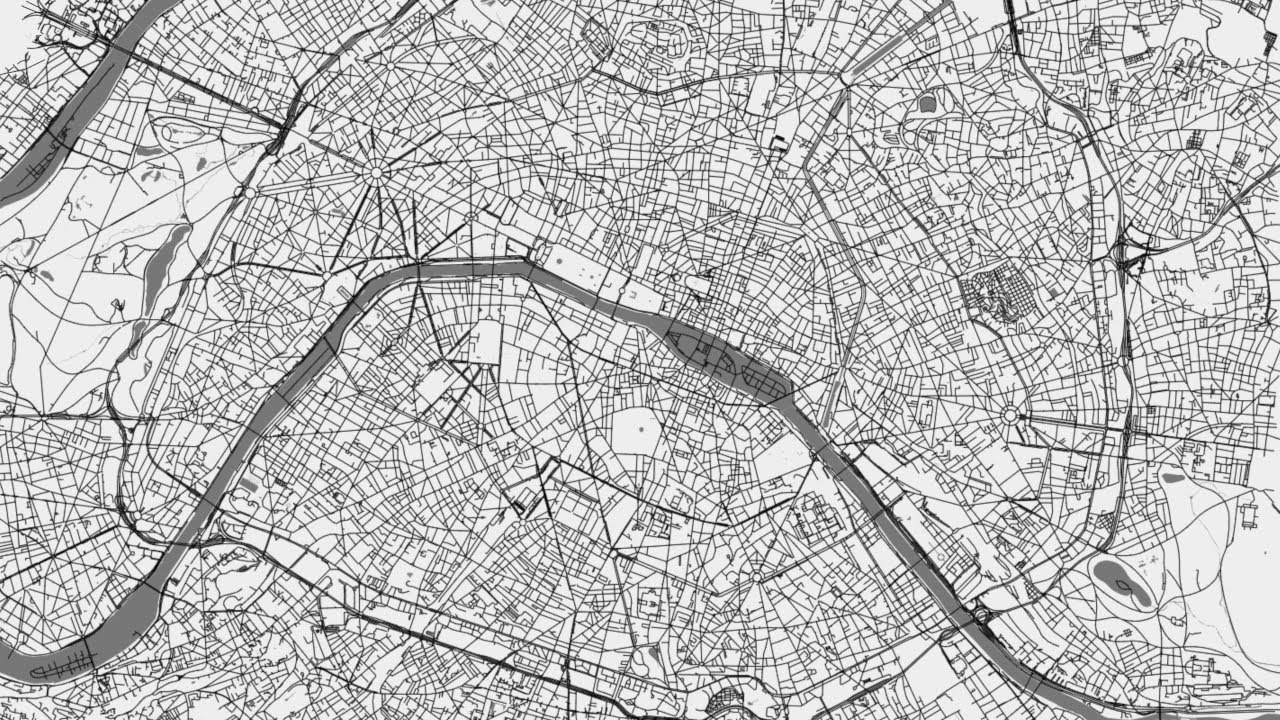
During my internet wanders, I stumbled upon a mesmerizing series of data visualization videos on the streets of European capitals. The videos were created by Anders Sundell who teaches data visualization at the University of Gothenberg. Here’s how he describes his video project:
“This is just a visualization of the street network of the central parts of ten European capitals. It does not show growth over time. The animation was coded in JavaScript, with the help of ChatGPT. Street data from Open Street Map. Previous videos: Asia:  • Streets of Asia United States: • Streets of USA Timestamps: 00:00 Paris 00:16 Berlin 00:29 Rome 00:43 London 00:59 Vienna 01:12 Madrid 01:28 Amsterdam 01:43 Copenhagen 01:58 Warsaw 02:12 Prague Music: Rejuvenate – Jobii from http://www.epidemicsound.com.”
nb: if the video fails to launch in your email, please click here.

